Introduction to Real User Monitoring (RUM)
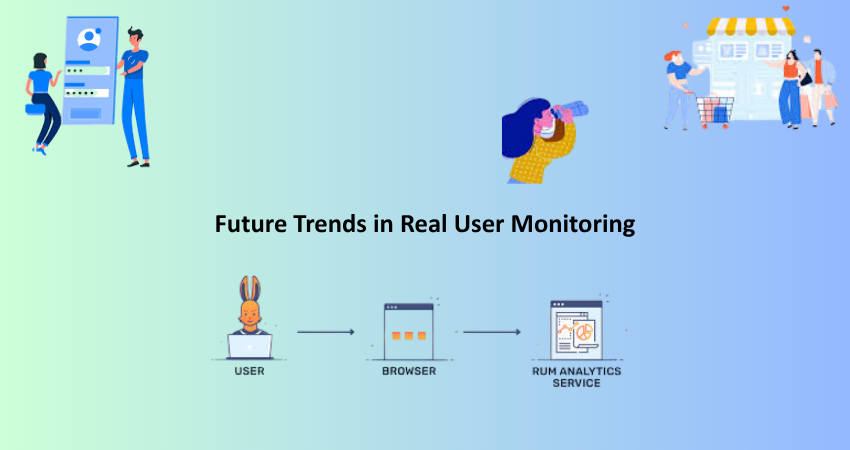
Real User Monitoring is the full form of RUM. It is a performance monitoring technique that captures and analyzes user interaction on a website or web application for real users. This is the absolute opposite of synthetic testing, which simulates user activity using bots. RUM sees real-user activity as the way to get all kinds of insight. RUM gives real-time insight into the load times of different web pages, delays in interacting with the website, and even the overall performance of a site. While synthetic tests might show some perceptible results and insights into performance, nothing beats real user testing in providing actionable insight on performance issues hidden from synthetic tests.
RUM works well in finding geographical performance bottlenecks, assessing device-specific problems, and evaluating the effect of third-party services on page load speed. It is a powerful weapon for companies that value user experience and want to make data-driven decisions to optimize their digital ecosystems. As user expectations for speed and usability continue to rise, integration of RUM-within your performance management strategy-becomes critical for endowing users with a seamless experience across devices, browsers, and types of connections.
Setting Up RUM: Tools and Techniques
Choosing the Right RUM Solution for Your Needs
There exists a plethora of Real User Monitoring tools available in the market today that have their own strengths and weaknesses. Some of the popular RUM vendors include Google Analytics (via Core Web Vitals), New Relic, Datadog, Pingdom, and Dynatrace. An appropriate RUM solution for consideration would have several factors including but not limited to ease of integration, type of metrics captured, and real-time capabilities, among others, cost. Core Web Vitals of Google include user experience metrics such as Largest Contentful Paint (LCP), First Input Delay (FID), and Cumulative Layout Shift (CLS). Therefore, it is the best candidate for most websites.
New Relic offers enterprise solutions with vast dashboards and customizable alerts and helps correlate front-end performance with back end performance for those teams who handle complex digital infrastructures. On the contrary, Pingdom and Raygun are much simpler entry-level solutions geared towards smaller organizations. Whichever you decide to go with, ensure that it matches the technology stack and gives you enough granularity about user data to help you make quick decisions.
Implementing RUM Code Snippets and Tags
Once you’ve chosen a specific RUM tool, the focus now turns to integrating said tool into your respective website or application. Most RUM tools will generally give you JavaScript snippets or tags to place somewhere in the HTML of your website. This snippet will often passively collect performance data as users interact with your site. Plugins and extensions are available for WordPress or any other CMS platforms, easing the way as they inject and set up in an automated manner.
It is vital to perform the testing in a staging environment prior to going live. At that stage, confirm if the collected data makes sense, if any performance impact is noticeable with the running of the script, and if the privacy policy is at all observed- primarily with regard to GDPR or CCPA. Therein, in no time, the tool will start collecting real user data so that you can get an incoming live stream of how users experience your site. At this point, you will analyze the data and tweak the performance.
Key Metrics Captured by RUM
Understanding Core Web Vitals
Core Web Vitals refer to a collection of performance metrics specified by Google to gauge real-user experiences. The three metrics are Largest Contentful Paint (what’s LCP), First Input Delay (FID), and Cumulative Layout Shift (CLS). LCP addresses the duration from when the LCP element (the largest visible content element on the page) is loaded to the time when it is fully rendered. FID refers to the amount of time that passes from the first user action triggering the event to browser response to that event, and CLS refers to the render stability of the page.
The effects of both metrics are, in fact, the speed and usability of the website as perceived by users. For example, a slow LCP could mean that the site delays the meaningful content for too long, causing users to exit. High FID would imply that the site remains unresponsive while time is spent executing heavy JavaScript about page contexts. Users are jostled around, frustrated when trying to interact with elements that move around a lot. Thus, these metrics are continuously monitored via RUM so that developers can detect regressions and quickly prioritize improvements that maximize user happiness and SEO rankings.
Evaluating Page Load Times and User Interactions
In addition to Core Web Vitals, RUM methods obtain the measurements that account for Time-to-first-byte (TTFB), total page load time, DOM content loaded time, and interaction timings. These broader parameters go on to provide a full account of the performance and help isolate metrics that actually fall outside the scope of Core Web Vitals metrics. For example, slow TTFB could be a sign of some bottlenecks server-side, while the DOMcontentloaded may be subject to delay because of a third-party script or inefficient JS blocking rendering.
Time from the user are just as important. There is timing for clicks, input response, and even behavior of scrolling. By judging the events from using different components, these would tell developers which parts are hammered by users. An example would be if the react renders a button to checkout taking ages to process; that may mean cart abandonment. The RUM data are a source of demonstrating A/B tests using different builds of UI designs or different approaches for loading with an engaging and efficient experience for a user.
Leveraging RUM Data for Continuous Improvement

Detecting Performance Bottlenecks in Real Time
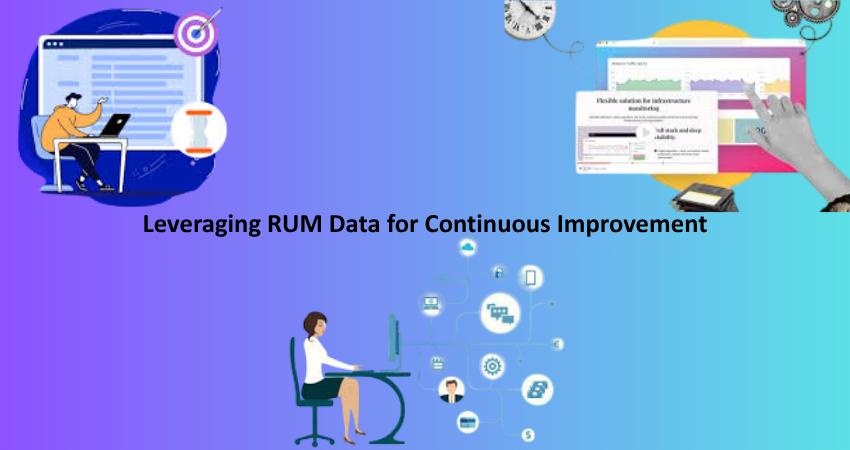
RUM’s most potent advantage is the ability to detect performance issues in real-time. In contrast to traditional performance testing—usually based on timed sets of tests, capturing mostly repeatable events which may not cover transient or user-specific problems—Real-user monitoring is capable of gathering information about every user at every moment. This means that when an anomaly occurs—for example, some regions go slow, rendering issues happen on certain devices, or some user actions trigger errors—RUM will alert the responsible people.
Consider a case where users from a specified country see extended load time consistently; RUM data can help pinpoint whether the issue stems from the CDN setup, third-party integrations, or DNS latency. Real-time visibility enables the team to apply the necessary fixes before the issues reach the wider audience. Dashboards and alerting mechanisms within RUM tools provide that perfect combination to remain abreast and agile to keep user experience standards sky-high.
Prioritizing Fixes and UX Enhancements
Once performance issues have been determined, the next action to tackle is prioritization. RUM lays down the context for teams to understand the real-world impact of each issue. For example, if a delay affects 80% of mobile users on the product page, this situation deserves higher priority than any bug concerning 1% of desktop users. This level of insight guarantees that the development effort will be focused on the changes that bring maximum benefit to the users.
Apart from resolving bugs, RUM can help identify opportunities for UX improvement. Users may be abandoning the form because of slow validation feedback, or they may be dropping from pages that have a CLS score in the high range. Such patterns emerge with RUM so that informed decisions can be made with respect to design and performance improvements. After a while, using RUM in an iterative feedback loop ensures a continuous user experience and better site performance metrics.
Integrating RUM with DevOps and CI/CD Pipelines
Automating Performance Checks in Development Workflows
By integrating Real User Monitoring into your development workflows, you take a huge step toward optimizing both the efficiency and reliability of your DevOps practices. With RUM data embedded in the CI/CD (Continuous Integration/Continuous Deployment) pipelines, teams can continuously monitor performance metrics every time code is pushed or deployed. No regression is injected, and their performance is enabled continuously throughout the life cycles of development with such proactive monitoring.
For example, if the LCP for one of the key pages goes over the limit after the particular code change, the pipeline can stop the deployment or send a notification to affected teams. These automations shape the culture of ownership and performance-centered development in which speed and user experience become the core quality attributes. Such repositories include GitHub Actions, Jenkins, or GitLab CI set to pull RUM metrics from deployment and notify in case cross-significant thresholds are crossed.
Using RUM Insights in Post-Deployment Reviews
After deployment, RUM data become the centerpiece in evaluating and analysis. Synthetic tests may validate successful deployments in simulated conditions, but RUM narrates the life story of how real users feel about the changes made to the site. Teams are comparing pre-and post-deployment metrics to measure the real-life implications of code changes on performance: a prime feedback loop to see whether optimizations are justified or introducing new pain.
Insights from RUM, then, inform where future development will head. An improved design could therefore become a reference for the interaction metrics coming from the next feature if it turns out to have improved such metrics. Whereas a deployment that worsens performance for a subset of users allows teams to investigate and roll back changes if needed. Integrating RUM into post-release processes solidifies the idea of maintaining performance not just until the development stage but throughout the entire lifecycle of the product.
Ensuring RUM Data Privacy and Compliance
Respecting User Consent and GDPR Guidelines
In the collection of real user data, privacy should be at the very top of the list. Real User Monitoring tools record detailed interaction and performance information that may contain user identification, geolocation, or device/browser specifications. Under various privacy regulations, particularly in relation to RUM monitoring, companies have to obtain consent through the GDPR and CCPA from users, especially in locations that have very strict data protection laws.
With the use of cookie banners or opt-in scripts, users can be made aware of, and accept, the procedure of data collection. Most modern RUM solutions built-in have privacy options for anonymizing data or masking PII. Furthermore, your privacy policy should mention what kind of data you collect via your RUM tools, how you use that data, and how long you keep it for. Following these guidelines will help you to avoid legal complications but also builds trust with your audience.
Data Anonymization and Security Practices
Revamping the anonymity and data privacy implementation within your RUM setup will be an excellent plus when it comes to the additional measures meant to secure user privacy. Referring to avoiding the capture of input fields for sensitive items such as passwords, credit cards, or personal messages, one can use masking techniques to ensure that such inputs are not recorded. Moreover, referring to RUM dashboards and source data should be restricted to access by authorized personnel only.
Another important requirement is to encrypt data during transmission and at rest. Therefore, all information acquired through RUM would be transferred over secured HTTPS protocol and stored in its database in an encrypted format. Through carrying regular audits, access logs, and compliance reviews, a sound security posture could be maintained. With these measures in place, businesses will confidently find them able to use RUM insights without compromising user privacy or violating any data protection laws.
Future Trends in Real User Monitoring

Advancements in AI-Driven Performance Analytics
The future here from RUM is increasingly being defined towards the use of artificial intelligence and machine learning technologies due to the complexity of web applications. The new-age RUM tools are ushering and embedding AI algorithms to analyze huge datasets and find trends or make predictions about performance problem areas before impacting user experience. As a result, it enhances the ability of businesses to proactively address issues rather than reactively, enhancing the stability of user experience.
AI-based RUM can also help detect anomalies out of the box—malfunctions like spikes in load times or drops in user interactions would be tagged in an instant. Enabling developers to recognize such patterns allows for faster identification of root cause, and shorter time to resolution. In the future, we envisage RUM solutions getting even more intuitive—proactively intervening with prescriptive insights so teams can take corrective action faster and more accurately.
RUM Integration with Edge Computing and CDNs
Another progressive yet forward-thinking trend among the web application monitoring kinks is combining the RUM instrumentation with edge computing and CDN infrastructures. Since RUM indicates user placement and regions-influenced delivery performance, getting rid of such data should lead to realistic content distribution integrated with appropriate edge delivery strategies. To take advantage of such RUM insights, CDN would route as much traffic through it as possible or cache content close to traffic hot regions to lessen the latency.
RUM is also evolving towards pages that will be scalable in use server-less or JAMstack architecture where performance administration for distributed applications will be integrated. Future RUM integrations will build on the previous integrations and go deeper into the understanding of how the edge services, micro-services, and third-party APIs influence the end-user experience. Businesses will be well positioned to deliver lightning-fast, globally optimized web experiences when they marry real-time user data with edge-savvy infrastructure.
Conclusion
Real User Monitoring captures a view into the actual travails of your visitors to your website. Realizing performance data in real time from actual users makes RUM more insightful in understanding bottlenecks, improving the site’s responsiveness, and providing smooth and enjoyable user journeys. From understanding Core Web Vitals to CI/CD pipelines, RUM changes the strategy development teams take to adopt and prioritize performance improvements.
As the demand for fast, reliable, and user-perceived websites continues to grow, RUM is rapidly becoming an essential part of the web development lifecycle. It is enabling a continuous optimization for data-driven decision making and continuing to evolve with strong privacy standards. As technology improves, RUM will only get better, providing even smarter ways of augmenting web performance from the end user’s viewpoint: whether that means AM or a little-known blog or operating a single centralized global web application. Real User Monitoring gives you constant insight into how users are interacting with your digital presence.